https://ukonward.com/reports/full-house/
Onward, Onward is a UK centre-right think tank developing bold and practical ideas to boost economic opportunity, build national resilience, and strengthen communities. 1200627
Full House
An experimental study on the impact of net migration on rents in England.
Onward, Onward is a UK centre-right think tank developing bold and practical ideas to boost economic opportunity, build national resilience, and strengthen communities.310310
Net migration to the UK has been extremely high, particularly from 2021, peaking at 906,000 in June 20231. Studies have already broken down the relationship between migration and employment, crime, and public services. But the impact of net migration on the UK’s housing stock is understudied.
To address this, Onward has created an experimental model focused on England. We use this model to produce estimates of the impact of net migration on private rents in England. The model in part relies on certain assumptions, which are detailed in the provided methodology note.
Onward’s model shows that net migration combined with an inelastic housing supply is driving higher rents. Since 2001, the impact of net migration on rents is approximately an additional £132 per month in England, in nominal value2. This figure increases to £216 per month in London.
These figures illustrate how even moderate changes in housing scarcity can have significant financial implications for renters. In short, high net migration has made England’s housing shortage worse, including in the private rental market.
Net migration and the housing market
The Government must confront the reality that high net migration, combined with a housing market that fails to deliver homes where people want to live, is worsening the housing shortage.
Too few houses are being built per year and England is consistently falling short of house-building targets. Since 2001, 4.5 million net additional homes have been added in England3. Under the previous Conservative Government, the target was 300,000 new homes a year in England4. But annual figures for 2021-2022, and 2023-24, show that only around 234,000 homes were built per year5.
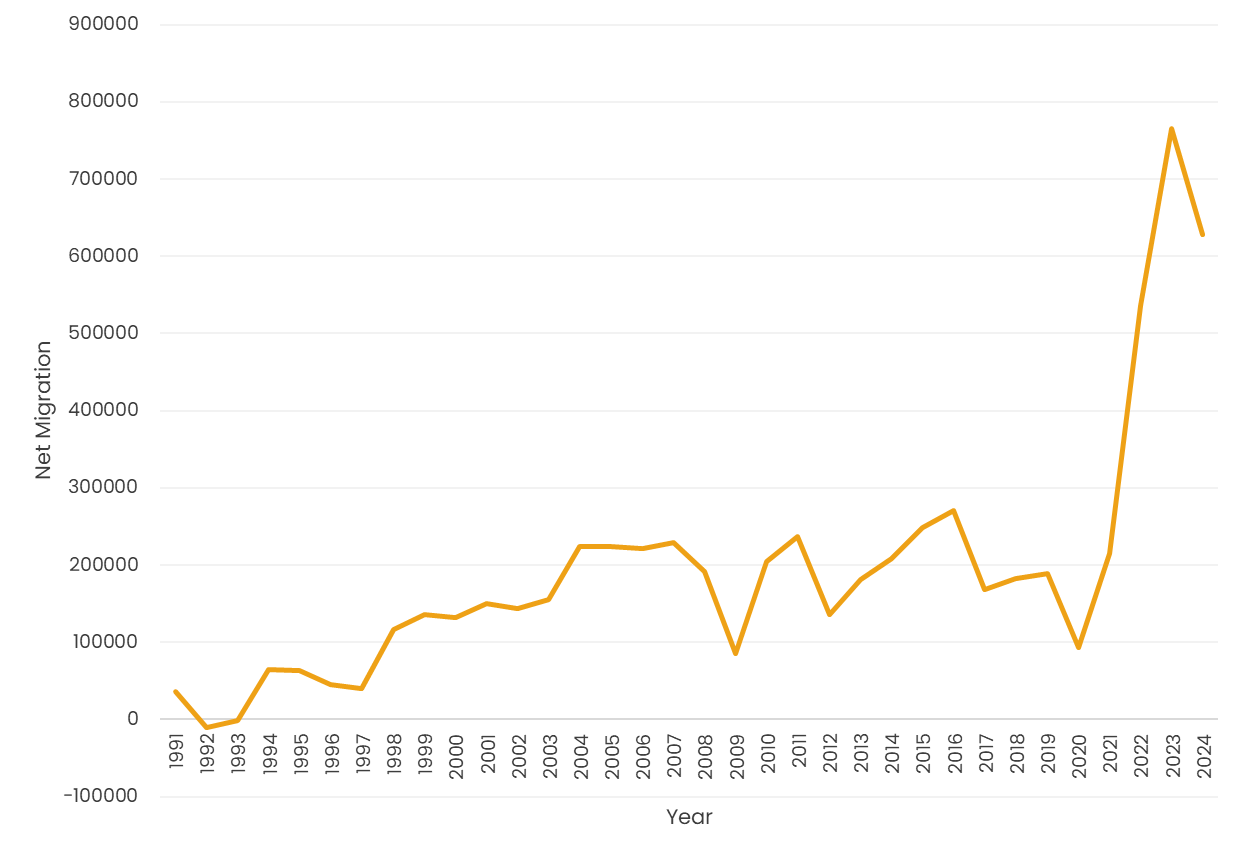
Since 2001, 6.9 million additional people have come to the UK and our experimental model assumes that 5.8 million settled in England.
Figure 1: Net migration to England modelled on the assumption of a proportionate intake by its population.
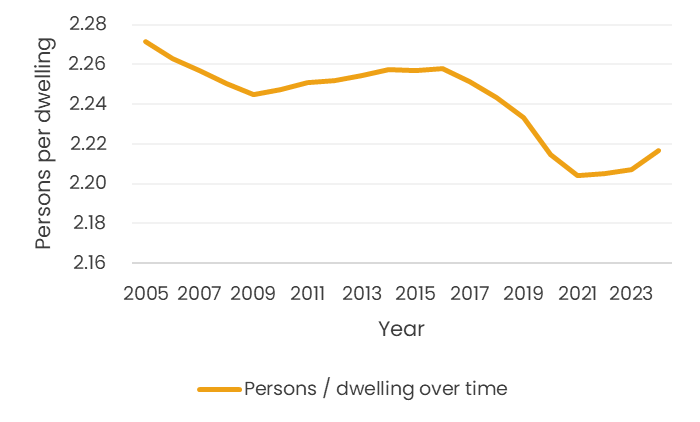
The impact of net migration to England on housing per person has been modelled in Figure 2, illustrating the number of persons per dwelling. The ratio has moderately declined over the years, owing to supply expansion, although the recent influx of high net migration has contributed to an uptick in the ratio. The chart indicates that increases in housing stock have helped alleviate the pressure of person per dwelling over the time period studied, but supply has not increased sufficiently to prevent or reverse above-inflation rent increases.
Figure 2: Persons per dwelling over time.
Sources: UK Parliament8, ONS9, Gov.UK10, Onward analysis
Using our model we have been able to identify the cumulative impact of net migration figures on rent, and compare it with the counterfactual of no net migration across these years. This calculation rests on the assumption that England has taken on a proportionate share of migrants according to its share of the UK population. We have calculated net migration’s impact according to dwelling stock and demand in England.
The model’s ‘Pain Index’, which captures multiple non-scarcity factors such as income growth and cultural shifts, indicates individuals’ willingness and ability to pay for rent. It operates on the assumption that, aside from net migration, all other factors have evolved identically across scenarios, enabling the model to calculate the rent differences between the actual data and counterfactual no net migration scenarios. Further information can be found in the methodology note.
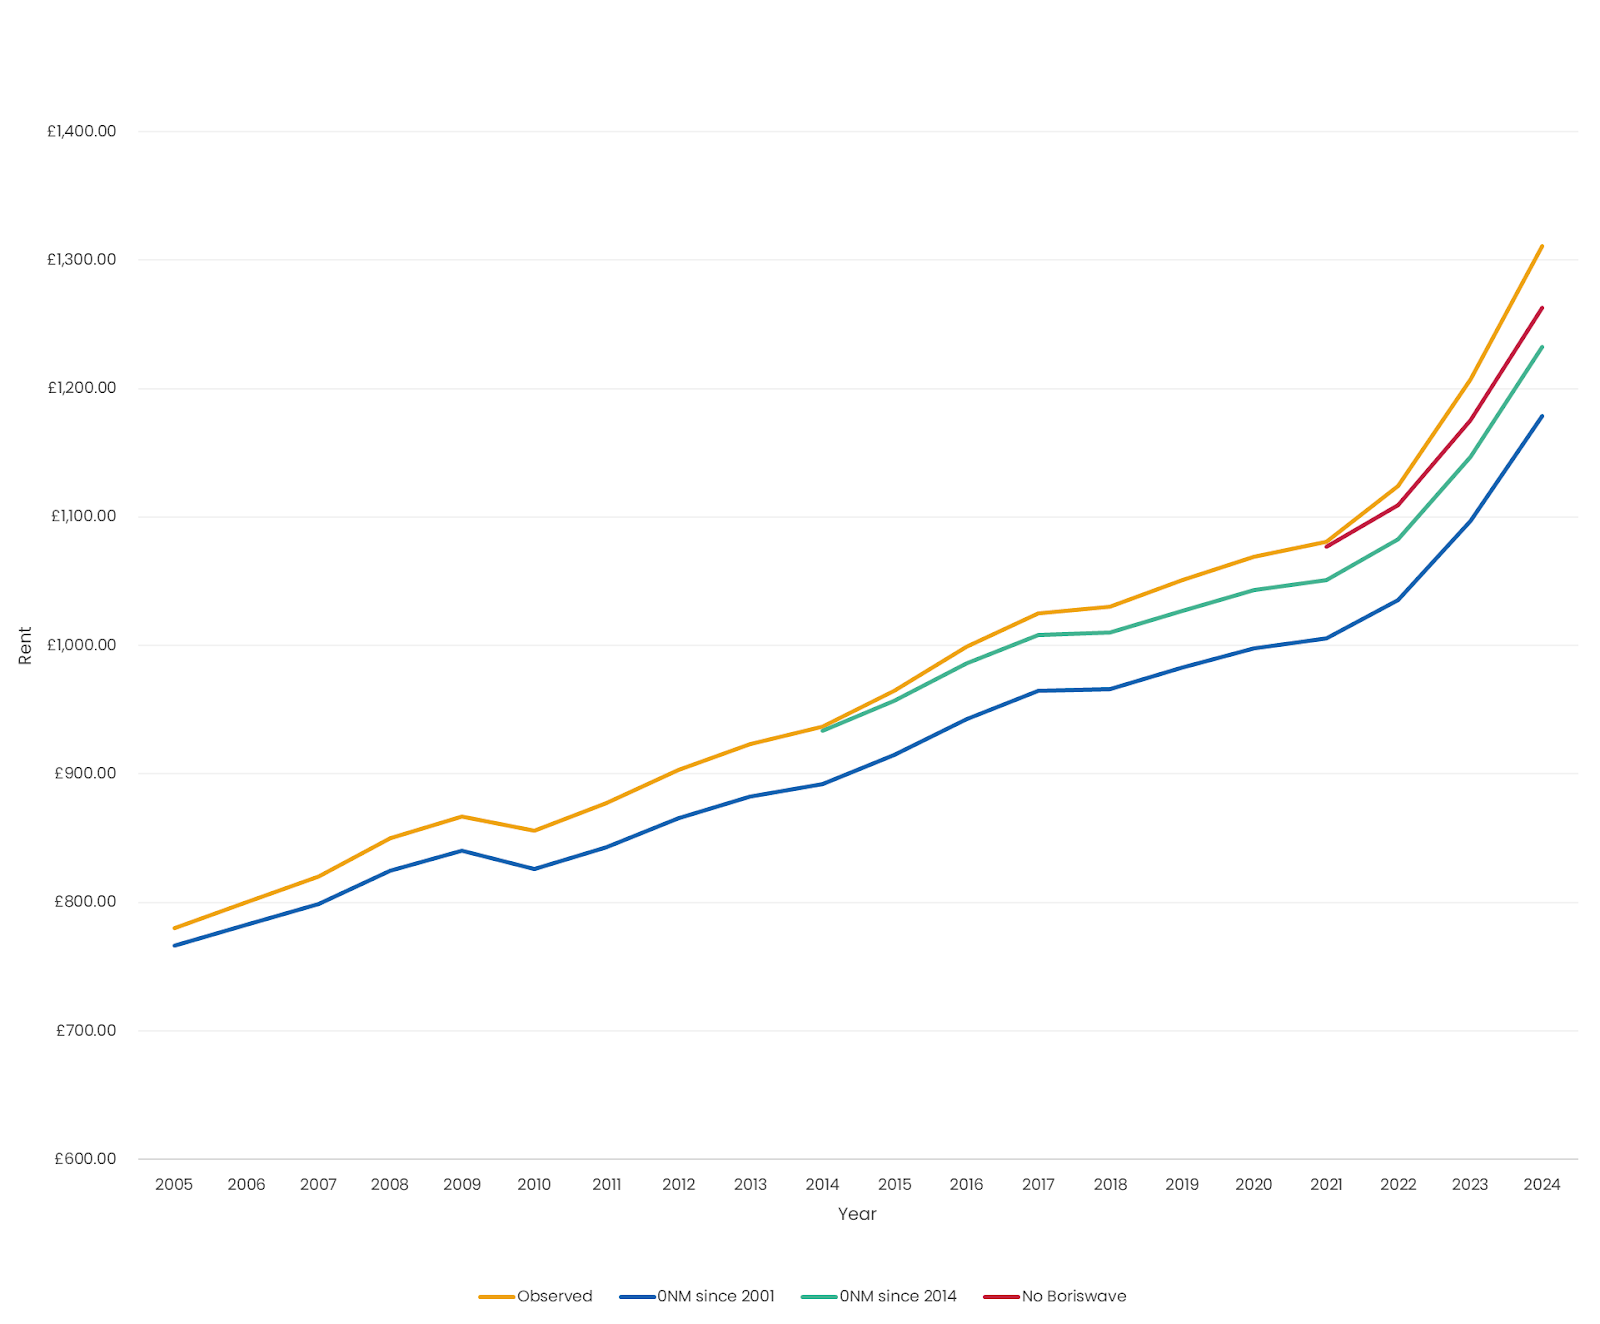
Figure 4: The impact of net migration on rent relative to the counterfactual of 0 net migration
Observed rent, or the actual growth in rent, has exceeded modelled counterfactuals assuming zero net migration from 2001, 2014, and 2021. These years were chosen to represent major turning points in UK migration policy: the onset of sustained high net migration around 2001; the rapid rise in net migration after 2014 to over 250,000 per year; and the so-called ‘Boris Wave’ beginning in 2021, when reforms under Boris Johnson’s government significantly relaxed immigration restrictions. The counterfactual scenarios isolate the effect of immigration by holding all else equal, including housing stock, fertility, wages, fiscal policy, and cultural attitudes toward housing, in order to identify the marginal effect of migration on rents alone.
Since 2001, the contribution of net migration on rents is approximately an additional £132 per month in England in nominal terms. Scaled up to the ratio of rent between London and the rest of England, this figure rises to £216 per month in London.
These higher rents represent a severe loss of disposable income for all of those stuck in England’s rental market, including for migrants themselves. In London the cumulative impact for somebody renting since 2001 would be £20,975 in nominal terms.
Housing is a necessity, an expense that people cannot avoid – as modelled in our pain index. The level of net migration to England since 2001 has exacerbated the imbalance between housing demand and supply, driving up rent.
Our model makes an estimate of the impact of rent, had net migration been zero from three different dates. Figure 6 shows our estimates of the savings per month that each renter could have accrued under each 0 net migration scenario.
Figure 6: The impact of net migration on England’s rents, by net migration scenario (per month).
Percentage Savings in England without Net Migration, Per Month
Absolute Savings in England without Net Migration, Per Month
Absolute Savings in London without Net Migration, Per Month
No net migration from 2001
10%
£132.16
£216.28
No net migration from 2014
6.0%
£78.67
£128.74
No net migration (“Boriswave”)
3.7%
£48.11
£78.72
Conclusion
Our experimental model allows us to estimate the impact net migration has had on the cost of renting.
Some of the migrants in the UK as a result of particularly high levels of net migration since 2021 will return to their country of origin, either by choice or when their visas expire. But many will settle here permanently, where they have the legal right to do so. Our model adds weight to calls for a fair and sustainable level of net migration going forward.
Equally, it reinforces the urgent need to build more homes for all UK residents, placing high priority on affordable housing in places, like London, where people want to live. This is key to the successful integration of recent cohorts of migrants, ensuring that everyone who calls the UK home is able to access housing at an affordable price.
Methodology Note
Estimating the Impact of Net Migration on Rents in England
This is a new and experimental model, produced by Onward, that estimates the impact of net migration on rents in England. A higher population drives up demand for housing, which also tends to increase rents. The force of supply (through new construction or conversions) can partly offset this pressure. But, because the relationship between people, housing supply, and rent is not linear or static, careful modelling is fundamental.
At its core, this analysis revolves around a simple balance:
Housing Scarcity: measured as the ratio of persons to dwellings.
Willingness and Ability to Pay: the proportion of income households are prepared to devote to rent.
As in any market, rent levels are affected by supply and demand as the market seems to reach equilibrium. Supply in the rental market is relatively price inelastic for two key reasons:
Homes take a long time to build; and
Switching homes from owner-occupation to rental and vice versa is also a relatively lengthy process.
When supply is inelastic, prices rise faster, particularly for essentials such as housing13.
While the stock of housing (regardless of tenure: ownership, social, or private rental) reflects absolute supply, rents are shaped by competition among households. This can be thought of as a continuous “auction” where renters bid as much as they can afford. Thus, the number of additional individuals in a market will impact rent, whilst supply is relatively inelastic and shelter is a fundamental need capped only by willingness, and more so, ability, to pay a certain level of rent.
The relationship between housing scarcity and rents shifts over time, influenced by broader economic, social, and cultural factors, such as wage growth. This is accounted for in the innovative variable, the Pain Index.
The ‘Pain Index’
To capture economic, social and cultural shifts, we introduce the concept of a Pain Index:
It represents how much financial “pain” (share of income) the average renter is willing to bear for housing at a given level of scarcity.
The Pain Index is indexed to 1 in 2015 for consistency.
It encapsulates all non-scarcity factors that push rents up or down including, but not exclusively: changing incomes, preferences for space, credit availability, and government policy.
Methodological Approach
This study has been conducted using the available data online, and therefore focuses on England for its relatively comprehensive availability.
Please find the sources used below the footnotes, and actively used in our GitHub link.
Step 2: Construct Counterfactual Scenarios
We then build three hypothetical “low migration” scenarios:
No net migration since 2001 This year is chosen to reflect the point at which sustained high levels of net migration to the UK began, marking the start of what is commonly referred to as the period of “mass immigration”.
No net migration since 2014 By this point, net migration had begun to rise rapidly, and thereon exceeded 250,000 per year. This marks a clear shift in the scale and consistency of migration flows.
No net migration since 2021 (“No Boriswave”) This scenario captures the sharp rise in immigration following reforms introduced under Boris Johnson’s government, which significantly relaxed restrictions and marked a new post-Brexit migration regime.
In each scenario, we recalculate population figures assuming zero net migration from the relevant year onwards.
Step 3: Calculate Adjusted Housing Scarcity
Population changes directly affect persons-per-dwelling ratios.
Housing stock is assumed unchanged by 0 net migration across scenarios (see assumptions).
For private rental sector dwellings, we apply a 15% efficiency adjustment, reflecting higher occupancy rates per floor area compared to owner-occupied homes. This aligns with Resolution Foundation findings and other data on floor space utilisation.
Step 4: Estimate Counterfactual Rents
With adjusted persons-per-dwelling ratios:
We apply the empirically observed relationship between scarcity and rents (modulated by the Pain Index) to estimate what rents would have been under each counterfactual.
Rents are expressed relative to post-tax median income, providing a meaningful measure of affordability.
Key Assumptions
As data quality varies, and as such with economic models, this experiment utilises a series of assumptions that enable us to calculate the impact of net migration on rent, relative to the assumption that all conditions remain equal minus net migration as a counterfactual.
The assumptions made are listed and explained below:
Assumption
Explanation
Migration Distribution
Migrants assumed to settle proportionally across UK regions; England’s share is derived from the share of a total national population.
Housing Stock
The total housing supply remains constant between scenarios, assuming no significant impact of migration levels on housebuilding output.
Housing Efficiency
15% efficiency uplift for private rental sector reflects greater occupancy per square metre; other tenures assumed equal efficiency.
Wages & Fiscal Transfers
Incomes (post-tax) are assumed to have evolved identically across scenarios, abstracting from complex second-order effects of migration on wages or public spending.
Cultural Norms
Cultural shifts in housing preferences are assumed consistent between scenarios; changes observed in the actual data are presumed independent of migration levels.
Natural Population Change
Fertility and mortality rates assumed identical across all scenarios, though in reality they might respond indirectly to housing costs or economic conditions.
Regional Rents
National rents are directly modelled on the presumption of a distributed national impact on rent; the figure for London is derived by applying existing ratios between regional and national rents, with the caution that these may themselves have evolved differently under different migration scenarios.
Findings
The model shows that lower net migration would have delivered modest but meaningful rent savings for the average renter. This equates to
£132 per month (10%) lower average rent nationally under a no-net-migration-since-2001 scenario.
In London, scaling up for the rent differential, this equates to approximately £216 per month lower rents, a substantial share of disposable income.
Limitations
While robust in approach, this model necessarily simplifies several complex dynamics to establish the model required to produce the above findings.
Data quality on housing efficiency is limited, making precise adjustments challenging.
Inter-regional migration flows are not fully captured.
Economic feedback loops (e.g. wages, productivity, fiscal policies) that might accompany different migration levels are not modelled.
Cultural factors that may evolve differently under differing population structures remain speculative.
Net migration is not necessarily dispersed according to national share of each UK country.
Housing stock, owing to consistency with political debate, reporting and data availability, rather than habitable rooms, has been used which does not reflect room counts.
Methodology Note Conclusion
By isolating the effect of net migration on housing scarcity, and accounting for how incomes and cultural norms interact with this scarcity, this analysis provides a grounded estimate of how much migration has contributed to rising rents. The results suggest that while migration is far from the sole driver of rising housing costs, it does contribute materially to pressures felt by renters, especially in high-demand regions.
Data is accessible at the following link, alongside the calculations and the sources for each individual dataset: https://github.com/ukonward/Full-House
Hilber, C. A. L., & Schöni, O. (2018). The Economic Journal, House Prices and the Economy: The Role of Supply Constraints. Wiley. https://doi.org/10.1111/ecoj.12213 ↩︎
If you value the work we do support us through a donation. Your contribution will help fund cutting edge research to make the country a better place.
Donate
Support Onward with a donation
About the authors
Laurence Fredricks
Senior Researcher
Laurence Fredricks is a Senior Researcher on Onward’s Social Contract programme and supports Onward’s Conservative Party Policy Review work. He has a BA in Land Economy from the University of Cambridge, as well as an MPhil in Planning, Growth and Regeneration. His expertise have contributed to a number of Onward’s former research programmes and reports, including Levelling Up, and Energy and Environment. He now specialises in housing policy, and sits on the High Street Policy Reference Group.
Before Onward, Laurence was part of the Stronger Towns Fund Evaluation Panel (POBP) and a Research Assistant to the Department of Land Economy at the University of Cambridge.
Martin Seiffarth
Policy Fellow
Martin Seiffarth is a former parliamentary researcher and public affairs analyst.