The Turnaround: Rebuilding Britain’s Economy
Gavin Rice |
Published 21 May 2025
 1200
627
1200
627
Gavin Rice |
Published 21 May 2025
Download this article as a PDF PDF | 2.76 MB
The British economy is stuck. We have to face facts: this is no longer a blip, no longer a temporary aberration, but a generational trend.
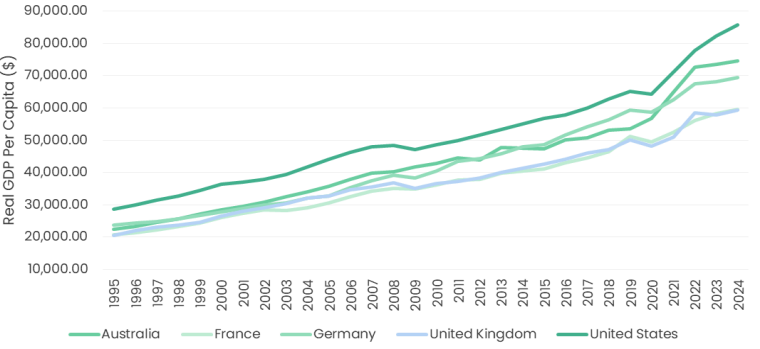
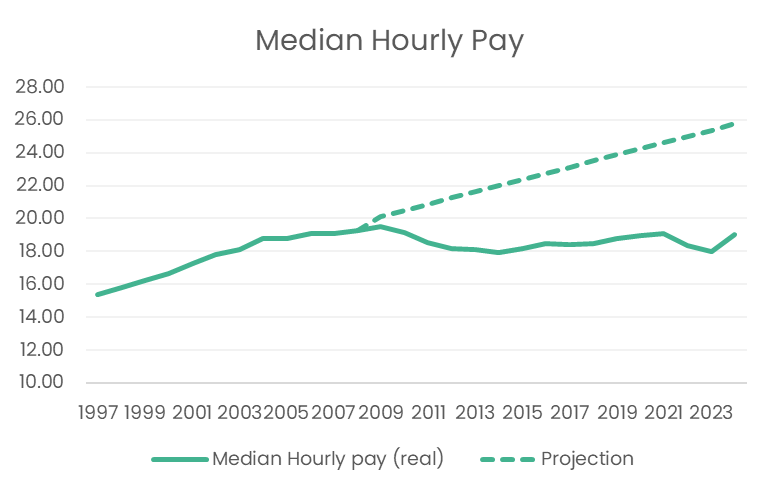
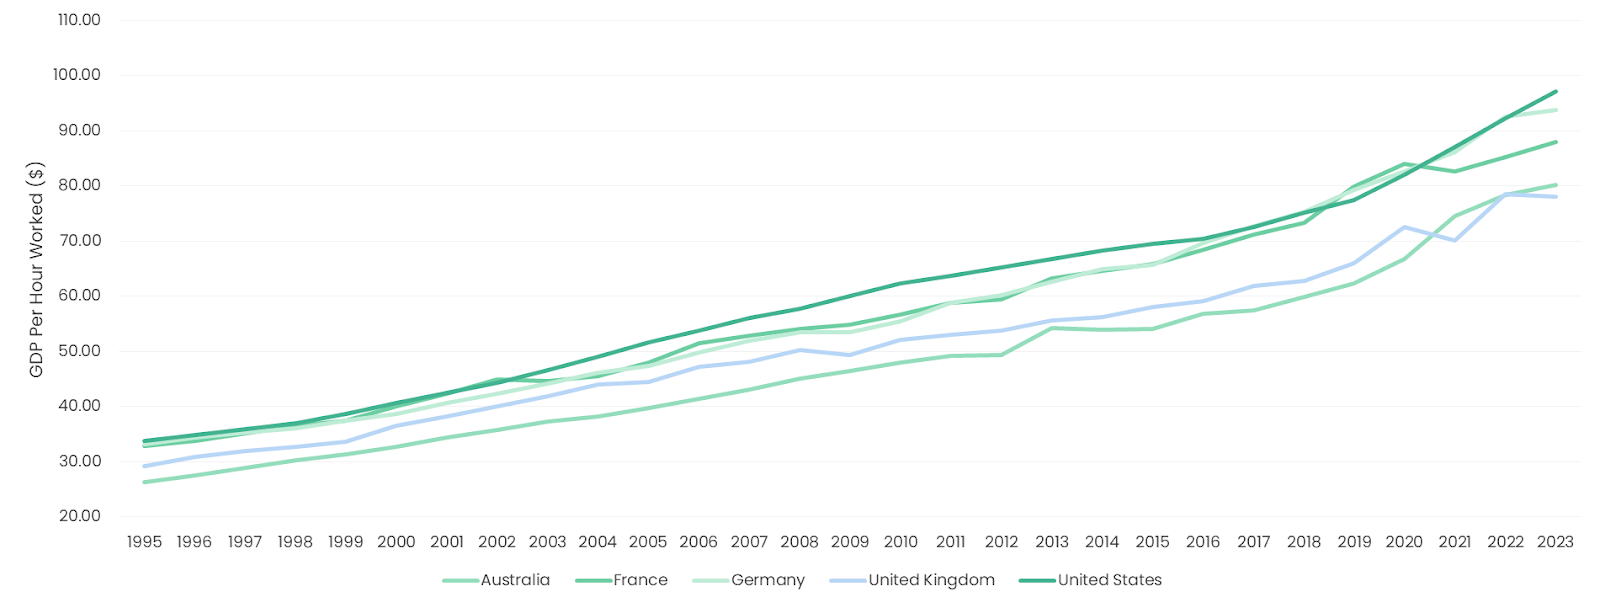
Real GDP per capita is still lower than in 2019, and almost no higher than in 2008. Average wages are no higher. British workers make nearly a third less than their American counterparts, while France is nearly 20% more productive than we are. We consume a lot, but invest and save little. Meanwhile, unprecedented and wholly unsustainable levels of immigration have generated an illusion of growth while doing nothing for living standards – except piling pressure on housing and public services while compressing wages for the lower paid.
We are held back by a stifling web of planning rules, bureaucratic regulations, taxes and self-imposed energy poverty – as many others have correctly argued. Rail projects take 50% longer here than in similar countries. HS2 became one of the most expensive railways in the world. We have a shortage of some four million homes through failure to build. We need radical supply-side reform to let markets do their work.
But this is not enough. The global economy is going through huge tumult. Punitive and arbitrary tariffs are not the answer. But the pace and manner of ultra-globalisation had become unsustainable, with Western economies naively accepting Chinese distortions and aggressive mercantilism. In this new era of competition for energy, chips, manufacturing capacity, minerals and new technologies, we must act robustly in the national interest to make Britain both more prosperous and more secure. This will involve deploying our nation’s pools of capital much more productively so great companies can grow, and building resilience into our supply chains.
Britain’s share of global trade is falling and we are offshoring industries at breakneck speed. Our country’s prosperity was built not on colonial exploitation, but on being the workshop of the world. Today, we neither make nor do enough of what the world wants and needs to buy. And just as we should be acting to reverse this deindustrialisation, Labour are hitching us to the EU’s burdensome carbon pricing system. Our industrial energy prices are already some of the highest in the world. This is madness – instead, we should seek to reindustrialise.
We must also make Britain fairer. We remain one of the most geographically unequal countries in the developed world, transferring more than £60 billion annually to keep regions beyond London and the South East afloat. And the social contract between generations is broken, with more young people choosing to leave for lack of opportunity, crushed by crippling taxes and house prices. For capitalism to survive, people must have capital. Making Britain fairer is not a luxury – we cannot fix either growth or the size of the state without extending prosperity more widely.
Britain can and must do better. We have the best universities, the best innovation and R&D, and some of the best tech start-ups in the world. We are world-leading in AI, quantum computing and life sciences, and in hard industries from aerospace to chemicals. We have the Golden Triangle and an amazing pool of talent and skills. Yet too many industries are under unsustainable pressure, and companies with huge potential are struggling to grow. Decline is a real threat – but it is a choice. Changing direction will be hard, but necessary. We must re-engineer the UK into a high-growth, high-wage, low-migration, productive economy. We owe it to future generations to act now.
Onward’s new research programme, Rebuilding our Economy, will lead the way in diagnosing these challenges and providing radical solutions. This paper lays out the direction our research will take, and the issues we will tackle. Through our work we hope to provide the ideas needed to make Britain prosperous once again.
Britain is stuck in a low-growth equilibrium. Incomes have not risen since 2008 but inequality has. The population is ageing and the country is facing a precipitous drop in industrial capacity in a less secure world. But Britain’s underlying potential is strong – decline is a choice.
There is no dispute that Britain is stuck in a growth crisis. Over the last ten years overall GDP growth has averaged just 1.44%,1 while the population has grown by between 4 and 5%.2 This matters because a fundamental principle of a market-driven economy is that consistent growth generates a gradual rise in overall living standards, reducing the political and moral pressure for wholesale redistribution. Growth provides the tax yields that fund our public services, the cost of which is only set to rise as our society ages. Just to fund current spending commitments without raising taxes, the Office for Budget Responsibility calculates annual GDP growth would need to be closer to 3%.3 And growth is the only way to maintain living standards in the face of inflation.
For too long policymakers have focused only on GDP and not on GDP per capita. Real net GDP per head in June 2024 was only £1,072 higher in today’s prices than it was in 2007,4 the pre financial crisis peak. And it remains lower than in 2019, before the Covid pandemic struck. Real wages have barely moved since 2008, and were falling during the bout of inflation the UK experienced in the wake of global lockdowns ending and the war in Ukraine. American workers earn around 40% more than their UK counterparts as US growth rates have accelerated.5 Underlying this is the UK’s flatlining productivity growth,6 which has historically lagged behind the US, Japan, Germany, Canada and France.7 This is a story of lost opportunity.

Source: ONS8
Without stronger growth, no other political goals can be achieved. But Britain suffers from other economic woes too. Its income inequality is relatively low, though this is due in part to its “bunched” income spectrum. However, it is suffering from increasing wealth inequality, with the opportunity to acquire capital – particularly a house – increasingly cut off.
A part of the story that is unique to the UK is the scale of regional inequality – it remains one of the most geographically unequal in the developed world.9 operating a large transfer union to the regions beyond London and the South East. And without London, living standards would be 14% lower, leaving Britain as poor as the US state of Mississippi.10
At the same time the country has undergone a profound loss of economic security. A loss of security in the sense of being increasingly beholden to soaring global wholesale gas prices given its status as a significant net importer of energy. But also a loss of personal economic security, caused in part by unfair competition from global low-wage migration, and in part by the rise in forms of unstable work in the gig economy. Putting these factors together, it is becoming increasingly difficult for British households to put down roots, own their own home and start a family. This compounds the demographic crisis the UK faces in the medium term, which will see the share of the population that is retired skyrocket relative to workers – a trend that is sadly set only to continue as the birth rate falls to below 1.5 children per woman, putting enormous pressure on future taxpayers.11
An economy can sustain relatively high inequality with healthy growth, and may survive lower growth with lower inequality, but it cannot sustain both simultaneously. And without faster growth the public’s political demands for better funded public services will simply be fiscally impossible.12 And the country faces this challenge in the most challenging of global contexts, with enormous disruption to supply chains, turmoil on global capital markets, an unpredictable United States and pressure to spend much more on defence. Britain must treat the growth crisis in effect as a national emergency. And it must rebuild with growth that is sufficiently widely shared, sustainable and built on strong foundations.
Onward’s new research programme, Rebuilding our Economy, will make the case for radical policy changes that will bring about significantly faster growth. It will argue for growth with a more even distribution across the geography of the UK so opportunity can be extended to the whole country and the need for internal regional subsidies reduced. And it will prioritise achieving greater economic security for British households and for the UK as a sovereign nation in a more dangerous world.
It will embrace root-and-branch supply side reforms to housing, planning, infrastructure and energy, with reforms to tax, incentives and regulations to achieve market-driven growth. But it will also argue for targeted industrial strategy in the UK national interest, aimed at rejuvenating critical industries in the private sector, achieving reindustrialisation and improving Britain’s trade performance. And it will develop a plan for place-based strategy to create new clusters of economic agglomeration outside the South East.
On the one hand the state is too large and too wasteful – ways to reform and reduce it will be the subject of Onward’s Reshaping the State Programme. But its most damaging impact on the economy is not what it spends on public services and social security. It is its effective prohibition of private sector investment through its approach to planning, regulation and energy – its interventions that do not come with a price tag except in lost growth.
Yet in other ways the state has been idly negligent – of nurturing UK manufacturing, building critical infrastructure, planning to capitalise on scientific and technological innovations and responding to the pressures of international trade. The lack of strategy, far from delivering optimal market outcomes, has ultimately led to a loss of productive capacity, in turn harming both growth and security. A state is needed that is smaller, stronger and more strategic.
The competing outlooks for the UK economy have been classified by some as “Boosters” and “Doomsters”.13While Boosters believe there is wide scope for the British economy to grow from its current baseline, Doomsters take the view that the UK is a mature, developed economy with little room left to grow, with future economic debates largely confined to questions of distribution.
The Doomsters are wrong, and for reasons that are in part alarming. The UK has a significant way to go and must think of itself as a catch-up economy rather than a mature one. It has some of the most valuable financial and professional services in the world, and is a major net exporter of these. Its reduced manufacturing base includes some of the most innovative industries including life sciences, pharmaceuticals, high-end automotive and aerospace and high-value defence manufacturing, with enormous potential to grow in output and value.
It is home to some of the world’s most cutting-edge innovation, with ready-made agglomeration in the Golden Triangle of Oxford, Cambridge and London, with the commercial potential of the knowledge base to which it is home so far not realised. And the UK has the opportunity to lead the world at the AI regulatory frontier, and is already world-leading in quantum computing.
Britain labours under stultifying supply-side barriers which need not be there, particularly around planning and regulation, has a constrained energy supply arising from more than a decade of poor policy choices, and has allowed value in supply chains to be offshored rather than captured when it could have chosen otherwise. Successive governments have chosen to pursue low-wage, low-skill migration as a pathway to aggregate growth, with consequent stagnating productivity and skills and significant overcrowding in its cities. The unfortunate truth is that Britain’s stagnation is down to political choices- at times, sleepwalked into.
The good news is that these choices can be reversed. And with the right plan, they will be.
British living standards have stagnated for some 20 years, underperforming other developed economies, while wealth inequality has been rising. This is a lethal combination.
The single biggest story in British living standards is the failure of the economy to grow on a per capita basis by any significant amount since the 2008 financial crisis. It is around one-third, or £10,900, lower than it would have been had the pre-2008 trend continued.14 And American workers make 40% more than their British counterparts. There have been 17 years with very little improvement to measurable living standards. In contrast, GDP per capita increased from £22,595 per year to £30,308 in the twelve years to 2007.15


Source: ONS19
Although income inequality has risen since the 1970s, inequality of income is not atypical for a developed economy. The share of national income going to the top 1% has roughly doubled since the 1970s, and the 90:10 ratio, which measures the ratio of income between the 90th and 10th percentiles, has risen from around 3 to around 4. This is higher than most European countries, but lower than the United States.20However, the share going to the very richest skews the picture. The income gap between the 25th percentile and the median is only around £10,000 per year,21 and the gap between the median and the 75th percentile is about the same.22
Britain has a “bunched” income distribution, with most earning within a standard deviation of the median. Income inequality is reduced in part by increases to the national living wage – though it is unclear how much higher this can rise without affecting employment. And earnings at the lower end of the income distribution are subsidised by in-work benefits in the form of Universal Credit. This is important because it means lower income levels are being boosted through distributive measures rather than growth.

The issue the UK faces is that the median, £37,430, is not high.24 In fact, it is below the level needed to be a net fiscal contributor. This means the average UK worker receives more in public service spending and social security than they contribute in tax – a minority subsidises a majority. In the year ending 2023, median equivalised household income was £37,300 but £39,700 after taxes and benefits.25
And while Britain is not especially unequal by income, its wealth inequality has risen, with the bottom 50% of the population owning less than 5% of the wealth and the top 10% owning 57%, up from 52.5% in 1995.26 Differences in housing wealth are a major driver of this, with more than 40% of all UK wealth being held in real estate27.This is not only about current ownership of wealth but about the ability to build wealth.
The UK’s tax burden is at a post-war high and could exceed 40% of GDP in the next decade (public spending is already higher than this). But personal taxation on income is relatively low for most British households, putting pressure on higher earners. Growth must increase so tax yields rise and punitive rates and thresholds must be reformed.
The overall tax burden – the share of national income that is taxed and spent by the state – is 35.3% and is forecast to rise to a post-war high of 37.7% of GDP by 2027-8.28This is moderately above the OECD average (currently 34%.29) However, this burden is spread very unevenly. In fact, the direct taxes on income paid by average and below-average earners in Britain are some of the lowest in Europe. Someone earning the median salary will pay less in direct tax on their income than their equivalent in the United States, Canada, Ireland, Australia, Germany or Sweden.
This is because the historically high tax yield is serviced by a diminishing share of the workforce – namely those on higher incomes. This has become the case through sustained fiscal drag, particularly the freezing of the income tax thresholds and especially the higher rate.30
So Britain faces a double challenge: its overall burden is punitively high but the tax base is unsustainably narrow, with too few people paying too much of the tax.

Conservatives in theory have a good track record here. A little known fact is that the median UK worker now pays almost £2,000 less in direct taxes each year, adjusting for inflation, than they would have paid on the same income in 2010.32 This is due to Conservative tax policies such as the personal allowance and reductions to employees’ National Insurance Contributions (NICs).33
How can this be, given the rise in the overall income tax burden? Britain has pursued a progressive approach to personal taxation, with the top tenth of earners – 3.6 million people – paying nearly 60% of all income taxes.34 In a low growth context it may seem fairer to shield middle and lower earners from the rising burden of taxation. But there are limits to how far those eligible to pay the higher rate can be squeezed through fiscal drag – the process by which more people and a greater share of their income are pulled into the higher rate through inflation.
In 2018-19, for example, the higher rate threshold – where a worker starts paying a 40% marginal rate – was £46,350.35It was subsequently raised to £50,000 but then frozen in the 2019-20 tax year.36 If a deflator is applied to £50,000 to 2018-19 prices it would be equivalent to £42,20037 – below the 2018-19 threshold. In today’s prices, the value of the higher rate threshold in 2009-10 was as high as £65,000.38 More earners are therefore being subject to higher rate tax via fiscal drag, and the value of someone’s income taxed only at the basic rate is being continually reduced.
The UK therefore faces a challenge due to the breadth of the tax base being eroded, while the share of the population that is shouldering the burden has been reduced.

As well as its rising tax burden and smaller tax base, Britain has highly punitive marginal tax rates (MTRs), especially around the income tax thresholds. When combining factors such as student loan repayment deductions, the High-Income Child Benefit Charge (HICBC), the higher rate of income tax and the loss of the personal allowance, marginal rates can exceed 70%.40Such rates are profoundly distortive to incentives.
In the Autumn Budget of 2021 Rishi Sunak, then Chancellor, cut the taper rate of Universal Credit – the rate at which the benefit is withdrawn as earnings increase – to 55p in the pound. This was partly in response to the argument that the old rate – 63p – was one of the highest marginal rates in the economy.41The same principle should apply at both ends of the income spectrum And it should be remembered that while higher rate payers are by definition earning above average incomes, this does not mean that they are particularly rich – UK incomes are “bunched” and houses are highly expensive.
There can be a tendency to focus too much on the impact of personal taxes on growth rates – though they undoubtedly affect incentives and people’s ability to save. Equally if not more important are business taxes. Again, there can be a tendency to fixate on corporation tax, though the importance of the headline rate can be overstated as it is charged on profits not incomes. The rate was raised from 19% to 25% under the last Conservative government and so regrettably is now less competitive. That said, it is not atypical within the G7 and remains below Germany’s, Canada’s or Japan’s rate.42
Business rates are a tax that receives less attention. However, they are structured in an extremely distortive and regressive way in the UK. They disproportionately punish bricks-and-mortar businesses, disincentivise expanding to new premises and their relative impact is greater outside the South East – where more economic activity is needed, not less.43 The UK’s infamous VAT threshold for small businesses, which kicks in at £90,000 per year of taxable turnover,44 is a major barrier to scaling up. And Stamp Duty, while it may raise more than £15 billion per year,45 deters property transactions, encouraging people to make suboptimal housing choices and slowing down velocity in the market.
The UK faces an extremely challenging long-term fiscal outlook given its demographic trajectory. Yet it is unacceptable for the overall burden of tax to continue rising inexorably – eventually the economy will reach its taxable limit. A combination of changes are needed to mitigate and reverse this, including a stronger birth rate, rising labour market participation and a higher rate of growth. But it is not only the overall tax burden that presents a problem. It is also the structure of the tax system and the deterrents to growth and work it creates that must be addressed.
Britain’s growth problem is at its core a productivity problem. Its excellent innovation is not being converted into productive output. It has too many low-value industries and unproductive workers. Its profound regional inequality is ultimately also a productivity problem.
Britain’s poor growth in GDP per capita and real wages is due not principally to taxes, denial of fair wages by employers or asset hoarding, but weak productivity. This refers to the ability of a worker to create more value with the same inputs of capital and labour (or to create the same with less). It lags the OECD average and other major comparator countries.

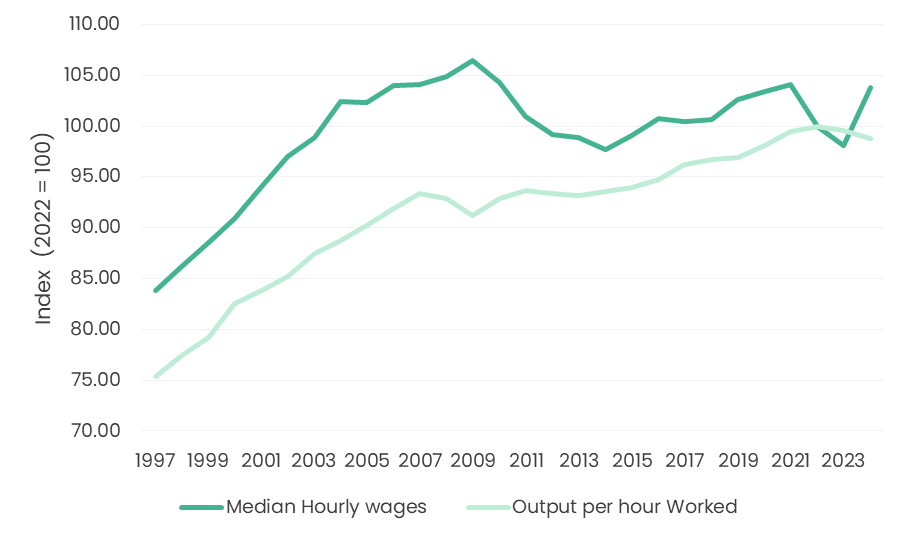
In the United States, productivity and wages have decoupled. This means that employers and owners of capital have been taking a higher share of the proceeds of their workers’ labour (and of their own investments). That has not been the case in Britain, where wage growth, or lack of it, has largely tracked productivity.
If you do not have productivity growth, the only way to increase national income is for people to work longer hours or for more people to join the workforce – whether this is through people moving out of economic inactivity or through inward migration, which brings its own problems (and assumes migrants will be net contributors).
There has been much written on the causes of the UK’s productivity dilemma with no clear consensus on one single cause. However, factors that contribute are low investment in things that will make workers more productive (automation, skills, machinery and other fixed capital investments), a misalignment of skills to jobs, a shortage of inputs – especially energy – and the lack of high-productivity industries.
There has been a significant decline in industries that typically have high productivity growth like manufacturing, and a lack of new industries combining technology with capital in a way that will generate productive output. There is also the question of the UK’s human capital: in addition to our existing skills deficit we have imported a new problem: a vast wave of low-skill, low-productivity migrant workers, which has adversely affected productivity performance.
The large and growing gap in productivity between UK regions is a major driver of divergent real wages and living standards. The differences in quality of life, opportunity and even life expectancy across the UK’s economic geography are sadly well known. What is less appreciated is the impact this has on the UK’s spending requirements. All but two British regions at International Territorial Level (ITL) 1 are net recipients of public money from the Exchequer.49
This is not by any means wholly in the form of welfare payments. This includes spending on public sector workers’ salaries, pensions, public service delivery and capital expenditure, too. However, the “balance” between the net contributor and net recipient regions is in excess of £60 billion per year.50
The UK’s regional net fiscal balance broadly reflects productivity performance. This means that regional imbalances are one of the causes of higher pressures on public spending and a large state. If more regions beyond London and the South East were economically self-sustaining, the burden of tax on the net contributor regions for internal transfers could be eased.
Source: ONS51
Figure 14: Change in gross value added by ITL3 region 2004-2022
Source: ONS52

Long-term growth comes from investment, not consumption, but Britain does not invest enough. It erects severe supply-side barriers to private sector investment and has hollowed out public capital spending. It has valuable financial services but UK businesses too often prioritise short-term profitability over capital investment. There has been a neglect of investment in automation and skills.
The UK is a low-investment economy. This matters because investment is the ultimate driver of productivity and long-term economic growth. Yet overall investment rates have been around 17-18% compared to the OECD average of 22%.54This has been true both of public investment and private investment. If UK business investment had matched the average of France, Germany and the US since 2008 our GDP would be 4% higher today, boosting wages by around £1,250 a year.55

One of the major barriers to private investment is the tangleweb of planning and regulatory barriers from which the UK suffers, plus the rising cost of core inputs such as energy. Bureaucratic, regulatory and cost barriers make investment in fixed capital, particularly plant, machinery and laboratory space, burdensome and long-winded. Political uncertainty and changes of economic strategy have not helped. Sensible measures have been implemented such as full expensing, introduced in the Spring Budget of 2023, which allows companies to offset 100% of certain capital expenses from taxable profits in the first year the investment is made.57 Rather than simply increasing corporate profits, this creates an incentive to invest.
However, there are less widely discussed hurdles, too. Britain is a low-savings, high-consumption economy.58 This means less money available in capital markets for productive deployment. It also has a high-performing but disproportionately large financial sector relative to the real economy. This sector provides a vital global hub of high value-added economic activity where Britain has a real comparative advantage. But there are also problems around short-term profit maximising being prioritised over capital investment. And while the financial sector is strong, access to long-term patient capital – long-term investments focused on building strong business foundations for sustained future growth – can be limited, with a shortfall estimated by UK Finance of between £3 billion and £6 billion.59
The UK spends less on R&D as a share of GDP than major comparator countries. At 2.9% it sits below the OECD average of 3% and falls behind Germany, Belgium, Israel, South Korea and the United States.60 This is partly due to lower public investment and partly due to private business investment lagging countries like the US, and is heavily regionally concentrated in the South East (over 50%), and in a few sectors such as pharmaceuticals, aerospace and IT. This is partly due to a lack of crowding-in dynamics beyond the South East and partly due to the UK’s sectoral mix – industries such as high-value manufacturing are more likely to invest in R&D than services sectors.61
Funny money
Britain also experimented with a period of sustained low and negative real interest rates in the wake of the 2008 crisis.62The purpose of this monetary loosening was to reduce the cost of corporate borrowing, reduce risk and incentivise investment in capital, training and R&D.
This is not what ended up happening. Partly due to global uncertainty and weak domestic demand, but also due to corporate incentives and priorities, cash ended up going into corporate savings, dividends and share buybacks.63 Monetary loosening also caused inflation of the real estate market by fuelling mortgage credit.64 And the attempt at monetary stimulus was also in tension with a contractionary fiscal approach pulling in the opposite direction.
Science and Technology investment
The UK has significant strengths in science and technology R&D, especially in its top universities. The main vehicle for public investment is UK Research and Innovation (UKRI), which oversees £8.8 billion of spending annually.65 Early stage innovation is strong but growth stage finance is weaker than the seed and angel investor environment. There remain significant regional disparities in investment in science and technology. And UK public investment has been disparate rather than focusing on specific sectors for growth, despite numerous science and technology strategies.
Manufacturing industries often have the highest potential for productivity growth yet represent just 8% of UK GDP – lower than any other comparable economy. We are too dependent on sectors like hospitality, retail and public sector work which in turn rely on migration, and Britain struggles to scale up innovative businesses. The decline of production sectors disproportionately affects regions outside the South East.
One reason Britain struggles to grow is that it lacks high-growth industries. Not all sectors have the capacity for equal rates of productivity growth and not all sectors are equally important as a share of the national economy.
Simply put, high-growth industries form too small a share of GDP while low-growth ones form too high a share. 81% of the UK economy is service-based,66 and productivity gains in services tend to be harder to achieve and more incremental. In contrast, manufacturing has an inherently greater capacity for productivity improvements since innovation can be applied to capital to improve output through technology and investment in machinery, automation and production processes.
Accommodation and food services, for example, represent 3% of GDP but have had negative productivity growth since 2001. Manufacturing represents now just 8.6% of GDP according to the most recent data,67 but has among the strongest productivity growth.
The UK’s most productive sectors, including high-value manufacturing, pharmaceuticals and life sciences, financial services and software technology are not large enough as a share of national income. Likewise, Britain’s strengths in innovation, particularly science and technology, are world-leading but it struggles to convert this fully into economic output. It struggles in particular with the scale-up phase of business growth, capital financing and retaining companies on-shore.68 And too many British companies simply stagnate – one in six medium-sized businesses have been identified as at risk of becoming “zombies”, meaning they simply cover operating costs without turning a profit.69
Manufacturing jobs pay on average 12% more per hour worked, due mostly to being more productive.70 Yet the UK is among the most service-dominated in the world, well below either European or OECD averages,71 with its manufacturing declining to just 2% of global output compared to China, which accounts for 30%.72 This trend towards deindustrialisation disproportionately affects regions outside the South East, which have historically depended more on high-value manufacturing industries and where there are fewer high-value service sectors.
This is to say nothing of the risk presented to supply chain security presented by advanced on-shore deindustrialisation – a risk made all the more apparent in an era of burgeoning global trade wars and acute dependency on strategically hostile trading partners and regions of high geopolitical risk.73
The loss of productive hard industry is therefore simultaneously damaging for growth, since manufacturing has high growth potential and higher productivity, harmful for fairness, since it reduces good quality employment and intensifies regional disparities, and problematic for security, since it means the running down of domestic capacity and ever more exposure to global risks.

The role of immigration in the UK economy is much debated. At an extremely simple level, inward migration raises total GDP.75 However, there is no correlation between migration levels and GDP per capita. In fact, increasing the population faster than the rate of growth will by definition cause GDP per capita to fall.76 And increasing the population without equivalent investment in public services and infrastructure will inevitably cause the UK capital stock to be spread more thinly.
There are also debates regarding the fiscal impact of migration. This depends in large part on the methodology for measurement. It is usually assumed by entities like HM Treasury and the OBR that immigration is fiscally net positive, at least in the initial years before migrants gain access to public funds. However, this is significantly alloyed by migrants on work visas bringing fiscally negative dependents who do not work. And most importantly, migrants who receive Indefinite Leave to Remain (ILR) and access to welfare benefits and the state pension, and stay in the UK permanently, stand much less chance of being a lifetime net contributor, depending on their average earnings.
Just over 52% of British people are net fiscal recipients from the state.77 Given the UK median salary is approximately £37,400,78 this would imply the earnings threshold to be a net contributor is a little over this. Migrants on salary discount visas and those who arrived before the threshold was increased in 2024 stand a high chance of being fiscally net negative. And this does not account for those who overstay student or work visas illegally, claim asylum, or otherwise move into illegal work. And this does not factor in the impact of very high net migration on housing costs or the distributional impact of migration on local wages, a dynamic that has now been recognised by the IMF.79
There is a wider question here, which is the dependency of the UK economy on low-wage migration. Nearly 14% of workers in wholesale and retail are migrants, and this sector accounts for 10.1% of UK gross value added. Likewise health and social work represents 7.9% of GVA and migrants account for around 15% of its workforce.80 Wholesale and retail trade and manufacturing add similar amounts to the national income each year – £205 billion and £197 billion respectively. However, manufacturing’s share of migrant workers is around half that of wholesale and retail.81
If the UK does not wish to be dependent on high-volume, low-wage, low-skill migration then it will need to reduce drastically the supply of labour from abroad, which will force employers to work with the contours of the UK labour market. Welfare reform will be required to reduce economic inactivity and free up labour. And employers will have to make productivity-boosting investments in skills and automation.
The UK will also need to accept that its more migration-reliant sectors may struggle and find solutions. This may mean increasing wages in necessary public sector areas like social care, or it may mean allowing less productive private sector businesses which rely on migration to die off. This should be seen as part of creative destruction, “unhooking” the economy from its low-productivity, low-wage equilibrium.
Source: ONS, Department for Education82
Britain has a globally leading edge in certain sectors, including life sciences, biomanufacturing, AI, pharmaceuticals, semiconductor design and financial and professional services. It also retains high-value advanced manufacturing champions like BAE Systems and Rolls Royce. The “Golden Triangle” of Oxford, Cambridge and London is home to some of the world’s leading scientific and technological innovation, including in the startup tech sector and from within the universities.
However, the UK has been very reluctant so far to pursue any kind of active, strategic approach towards its sectoral mix. Although there have been multiple “industrial strategies” published by successive governments, these have not been translated into concrete long-term interventions that can build long-term capacity.83
The UK faces certain key threats and risks including loss of technologically, economically or strategically significant industries and the failure to grow these industries. Britain struggles with commercialising its innovation in AI and quantum computing and cannot always retain intellectual property, with significant offshoring to the US. Advanced manufacturing robotics have struggled to scale up. The UK has strength in chip design, Arm being the most obvious example, but is highly reliant on international supply chains for chip manufacturing. Its pharmaceutical sector is strong but lacks on-shore vaccine manufacturing infrastructure. The removal of Huawei from its telecommunications infrastructure exposed its lack of alternative suppliers for 5G and its reliance on a small number of overseas suppliers. And the UK has minimal domestic extraction or processing capacity for minerals such as lithium, cobalt or rare earths, which are foundational for electronics.84 While the UK has historically retained significant strengths in chemicals manufacturing, in recent years the UK chemicals sector has been in freefall, largely due to energy costs.85
Despite its longstanding policy commitment to net zero, the UK has failed to develop on-shore green technology or infrastructure manufacturing, remaining highly depending on imports for batteries, EVs, solar panels and wind turbines.86
The Information Technology and Innovation Foundation (ITIF) ranks the UK in the top ten producers of strategically significant industrial outputs in its Hamilton Index. It notes in particular the country’s strengths in aerospace and IT. However, in most other listed sectors it is in relative global decline.87
The UK therefore needs a pragmatic and achievable industrial strategy which seeks to build on existing strengths, facilitates commercialisation of innovation, boosts applied R&D and builds supply chain resilience through on-shoring and near-shoring where possible. This will involve a combination of policy levers including the better targeting of limited subsidy budgets, tax relief, transformation of institutions like the British Business Bank, mechanisms to improve strategic sectors’ access to credit, co-investment with golden shared for government, interventions to prevent offshoring where necessary, a policy of energy abundance and re-equitisation of the institutional investor landscape with a focus on strategic industrial priorities. And it should pursue place-based strategies to create industrial clusters and the agglomeration effects that will flow from this.
One of the biggest under-used policy levers at the Government’s disposal is its procurement budget. Factoring in the whole public sector including local authorities, procurement represents one-third of government spending.88 The EU’s procurement framework is focused on deepening the Single Market and promoting cross-border access. However, outside the Single Market the UK can repurpose national-level procurement spending in a way that targets industrial strategic priorities, including building vital capacity domestically.
State imposed barriers to residential and commercial building are a major breakwater on market-driven growth. Some of these planning restrictions are environmental, some are building regulations and others concern approval for the use of land. Judicial review, quango oversight and consultations add to this stranglehold. Major reform to planning laws is needed so the UK can build again, and net migration cannot outpace housebuilding.
Britain has a well documented housing shortage of more than four million units.89 It has one of the lowest vacant property rates in the OECD at 5.4% according to the 2021 census.90 The mathematics of this are quite simple: the UK has rapidly grown the population at a rate much faster than the pace of housebuilding.
As a result, average house prices are now eight times average income, and this is even worse in London. This compares to an average of three times in the 1970s. The average first-time buyer deposit in England is now £68,000,91 with a deposit now taking on average eight to ten years to save for.92
At the same time, mortgage credit has expanded dramatically as a share of GDP has risen from around 40% in the 1990s to around 60% now.93 This increase in mortgage credit, which includes lending to commercial and buy-to-let investors as well as owner occupiers, has inflated property values on the demand side by increasing purchasing power in a restricted market.
In London in particular the financialisation of housing as an investment asset for overseas and institutional investors has inflated demand and absorbed limited housing stock as London has become an attractive global real estate investment destination – London was the largest destination in Europe for overseas capital inflows into real estate in 2024.94 In 2024, overseas purchasers accounted for 45% of property purchases in prime central London (PCL), up from 39% in 2022.95
This would be less of a problem in an environment of housing supply abundance. However, with the supply of new housing incredibly restricted, the incentive for institutional investors to speculate on UK land value appreciation is only enhanced, creating an inflationary feedback loop and making owner occupation harder still. And liberalisation of housing supply will not bring down prices if net migration continues to outstrip housebuilding.
Radical reform to housing in Britain will therefore require significant supply liberalisation, particularly in areas of high density and high demand such as cities. But it will also require serious restrictions on demand by reducing immigration and by taking steps to limit overseas ownership of new housing and investment properties remaining vacant.

Source: Ministry of Housing Communities & Local Government, Department for Levelling Up, Housing & Communities,97 Onward analysis
The UK’s severe challenges in building new infrastructure and approving commercial planning applications are well documented.98 In 2024 only 19% of major planning applications were approved within the 13 week target at the district level.99 And at a national level 34% of major planning decisions took more than four months.100
Approval rates are low. At the end of 2024 for every five planning applications granted, four were rejected.101The embedded resistance to new development flows from a web of legislation and regulations, starting with the Town and Country Planning Act.102 Approval processes remain overwhelmingly in the gift of local authorities who do not share responsibility for nationwide economic growth. And while the Minister for Housing, Communities and Local Government (MHCLG) retains significant statutory powers to call in planning applications for central review, there are significant political barriers to the exercise of this power.
Building and environmental regulations present serious barriers to development, and the consultation and judicial review (JR) process mires building projects in bureaucracy and the costs and delays inherent in lengthy legal challenge.103 And far too much power has been delegated to unaccountable quangos whose decisions are never subject to democratic review, and whose incentives are not calibrated towards economic growth.104

Planning applications are expensive: more than £250 million has been spent on the Lower Thames Crossing’s 63,000 page planning application, for example. In effect, this means a quarter of a billion of public money spent so one branch of government can ask another branch of government for permission. This is more than double the cost of building Norway’s Laerdal tunnel, the longest road tunnel in the world, just for the planning stage of a project.106
When infrastructure is built, the cost is much higher in the UK than in other comparable countries.107 For example, the average cost for a flat road in the UK is £8.45 million per lane kilometre, compared to the European average of £5.77 million and £4.22 million in France. Similarly, UK road projects face both the highest regularity (69%) and severity (66%) of cost overruns compared to peer countries.108


Source: Boston Consulting Group109
High energy prices devastate energy intensive industries and destroy real household incomes. Prosperity tracks energy consumption almost exactly. Energy abundance must be the priority to reverse deindustrialisation, restart growth and bring costs down. Britain has allowed itself to become far too dependent on importing gas and electricity and must reform contracts and pricing while prioritising boosting domestic energy supply.
Britain now has the highest energy prices in Europe.110 This is due to a number of factors. One is its high reliance on natural gas both for electricity generation and for home heating. Around 40% of UK electricity is generated from gas compared to a 22% EU average, and 85% of British homes use gas for heating – higher than in most European countries.111 This leaves it exposed to fluctuations in wholesale gas prices.
At the same time it has extremely limited gas storage facilities, with capacity to cover only around five days of consumption. In Germany, in contrast, gas can be stored for up to 90 days. As a result, approximately 35% of UK produced gas is exported.112 And policy choices have been made not to pursue onshore energy supply development through hydraulic fracking or expanding North Sea oil licences.
The structure of the UK electricity market also pushes up both household and industrial energy prices, as prices are set according to the most expensive source needed to meet demand – typically gas, which sets electricity prices more than 80% of the time.113
Industrial energy costs are a severe problem for the UK economy. While it used to have lower prices than the EU average, UK firms now pay more than four times as much for electricity than the cheapest locations in Europe,114 and 150% above the EU average.115 And despite having similar electricity prices at the turn of the century, energy in the UK is four times that of the US.116 This is having a particularly damaging impact on the regionally important chemicals sector,117 which has contracted by more than a third in three years,118 in line with the drop in output of of Energy Intensive Industries (EIIs) since 2021 more widely.119 Output in the UK’s EIIs is at its lowest in 35 years.120
Britain has also historically been a part of the European carbon pricing mechanism, which was largely replicated into UK law after Brexit, and has now been reintroduced by the Labour Government as part of its EU reset.121 This has disproportionately harmed energy intensive industries like manufacturing, but is also a significant cost burden for energy intensive new technologies like data centres and gigafactories.
The UK has made rapid progress towards territorial – that is to say on-shore – decarbonisation. But its contribution to global carbon emissions when measured by consumption is actually increasing.122 This is because industrial production has been offshored to manufacturing intensive net exporters like China, which still makes extensive use of fossil fuels including coal-based electricity generation. Britain’s “unilateral” approach towards decarbonising has therefore reduced UK growth and accelerated offshoring without reducing our net contribution to climate change.
Decarbonisation has therefore been pursued not by replacing the supply of fossil fuels with renewable alternatives, but by reducing Britain’s energy consumption – the UK has reduced per capita consumption of electricity more than any other OECD country, and this is due almost entirely to loss of industry. Meanwhile since 2003 China has more than doubled its energy use.123
Looking at where energy use has fallen, manufacturing accounts for two thirds of total energy use reduction, while household consumption accounted for a quarter, and just 9% from the rest of the economy.124
This approach is nonsensical.

Source: Our World in Data126
Energy is a critical factor of production. Without it economies cannot function. In fact, per capita economic growth almost exactly tracks changes in per capita energy use.
UK energy policy has effectively pursued a de-growth approach without this ever being explicitly stated. It is vital that we jettison the idea that growth can be achieved without secure and affordable energy. The alternative is simply having less economic activity.

Recent events show how exposed the UK is to changes in international trade conditions. Britain has always been a trading nation and its households benefit from imports. But it has become reliant on strategic enemies such as China and vulnerable jurisdictions like Taiwan for critical imports like steel and semiconductors and for the capital to finance its trade deficit. It needs to boost domestic production, reshore and friendshore supply chains where it is beneficial and decouple from high-risk supply chains. It must also develop a domestic start-to-finish defence manufacturing capability and boost exports.
The UK runs a large and persistent trade deficit – its net exports of services do not fully finance its deficit in goods. This deficit when added together with other net inflows and outflows of income forms the “current account”. Current account deficits are common in developed economies, but they must ultimately be financed somehow. In short, the UK does not pay its way in the world by making and doing enough of what the world wants and needs to buy.128
By most indicators the UK underperforms on trade. Trade as a share of GDP is lower than the OECD average at 55%, compared to Germany’s at 90%.129 And its share of global trade has declined to just 3.5% of exports and 3.7% of imports, down from 5% and 5% respectively in 2005. Meanwhile China’s share of global exports is now more than 17%.130 Imports are vital for the UK economy. This is true not only for household consumers but also for manufacturers, who rely on globalised supply chains. In fact most exporters are also major importers.
However, significant imbalances arise when a country’s exports do not pay for its imports. This tends to have a negative distributional impact, harming former production communities and sectors. Persistent current account deficits tend towards higher inequality. And a declining share of trade is an indicator that an economy is doing less than it could or should be.
The global tariffs imposed by the US Administration are causing significant trade disruption and this is likely to harm the UK. It will be necessary to improve both supply chain resilience as trade friction increases and to improve export competitiveness if the US market is more closed off.
It is however important to recognise the global imbalances in trade to which the Trump Administration is seeking respond. China’s large trade surplus is not only the product of Chinese innovation, competitiveness and efficiency. It is also the product of Beijing’s aggressive trade policies. These principally include manipulation of China’s currency, the renminbi, to keep its exports artificially competitive, significant subsidies and the suppression of workers’ rights and wages to reduce labour costs. China has been able to pursue these trade distortions in part because it is classified as a developing country by the WTO.131
The purpose of these “beggar-thy-neighbour” policies is to create Chinese export dominance, to control a large share of global manufacturing capacity and to gain a controlling interest in assets in trade deficit countries like the UK and US, where the proceeds of its trade surplus are invested.132
The American attempt to respond to Chinese distortions and the imbalances they create domestically within the US is likely to trigger a wider rethink of the progress of globalisation. Already, otherwise liberal economies are beginning to pursue national industrial policies to protect their own industries and supply chains, and to secure access to strategically important materials and technologies.133 It will be insufficient in a world where such approaches are the norm for the UK to pursue a wholly laissez-faire approach towards trade – others will not be doing the same.
Rather, Britain should pursue a radically pro-growth, supply-side policy to unlock market potential domestically, combined with a much more pragmatic and strategic approach towards critical industrial capacity and trade performance.

Source: UN Trade and Development Data Hub135 Onward analysis
Like the United States, Britain is a consumer of last resort for goods from surplus countries like China. This is financed by capital inflows from abroad into equities, real estate, debt and infrastructure. This capital is not necessarily productively deployed, and the UK’s own capital markets are not optimally invested, either. We must take steps to unlock dormant capital and reduce dependency on foreign ownership of key national assets.
The other side of the current account deficit “coin” is the UK’s capital (or “financial”) account surplus. This represents the flow of capital into asset ownership, including real estate, equities and debt. This net inflow of capital each year is what allows Britain’s current account deficit to be financed and for imports to be paid for.
Some economists believe this to be perfectly fine. Net exporters send the UK goods and in exchange Britain sends them “bits of paper” or IOUs. There is some truth to this; foreign investors’ desire to put capital into the UK allows us to buy goods from abroad, keeping goods cheaper and lowering our cost of living. But there is a downside, which is the loss of sovereignty implied by mass overseas ownership of UK assets, and the risk and exposure presented by this capital surplus dependency. Ultimately debts, whether corporate or public, have to be serviced, and any loss of confidence in the UK as a destination of asset investment would cause major problems for Britain’s ability to finance its balance of payments.
Furthermore, these inward capital flows put upward pressure on sterling, crowding out and disincentivising domestic investment and saving. This in turn reduces the availability of domestic private capital for corporate financing and in turn means less liquidity for the real economy.136
Source: ONS137
Alongside other countries with persistent trade deficits, like the United States, the UK is a destination for global excess savings generated by the trade surpluses of other countries. This phenomenon has been well documented by economic thinkers such as Michael Pettis, Steve Miran, Oren Cass and Dani Rodrik.138
The global reserve status of the US dollar and the utility of sterling as an investment currency create demand for assets denominated in those currencies. To accommodate these global capital inflows, domestic savings will decline. The upward pressure on the currencies makes UK and US exports less competitive as they become more expensive in global terms, while purchasing power to buy imports is increased. The overall impact of large foreign capital surpluses is therefore to disincentivise domestic investment, and that the surplus must be mirrored by a current account deficit. As a result, overseas investors acquire an ever greater share of UK assets and both public and private debt must rise.139
The supply of UK private capital is also unproductively deployed. This is partly due to the impact of regulatory reforms to pension fund investments made under New Labour with the aim of protecting people’s savings. But the result has been huge over-investment in real estate and bonds and consequent de-equitisation (divestment from equities.140
A major barrier to stronger UK growth is this flight from productive investments. UK firms struggle with access to capital finance, particularly in the economically important manufacturing and science and technology sectors. Pension fund reform is therefore needed both to generate stronger receipts for savers and to provide British firms with adequate finance.
There should be a much greater role for institutions like the British Business Bank to direct national savings towards productive and potentially high-return industries with strategic significance, particularly in emerging technologies and critical supply chain capacity.


A feature of the UK’s dependency on overseas capital is the level of foreign ownership of its equities. Overseas ownership of UK quoted shares in 1963 was just 7% and in 1997 this was 28%. It is now nearly 60%.142
Britain therefore struggles with the misallocation of its on-shore wealth into real estate rather than capital markets, and with its dependency on inward capital flows into housing, commercial property, public and private debt and equities. This model of a highly unbalanced relationship between national income and foreign investment relies on a constant flow of overseas capital and of assets for foreigners to purchase, and therefore on international investment confidence in the UK, and leaves the country more exposed to fluctuations in interest rates in corporate debt markets and to changes in bond yields. It also increases inequality by moving the centre of economic gravity towards financial services and asset management, largely concentrated in London, and away from manufacturing, which is largely based outside the South East.143
Britain’s dependency on foreign capital to finance its consumption and public borrowing requirements has been described as relying “on the kindness of strangers”.144
Britain significantly over-produces graduates and tertiary education is not linked to the needs of the economy. This means high growth potential sectors lack the skills they need and some industries need migrant workers from overseas to plug the gap. Reforming post-18 education, welfare and visa rules together will be vital to ensure we are training the skilled workers the economy needs.
Britain has an unprecedented rate of entry into higher education, peaking at 38.2% in 2021 and falling only slightly to 36.4% in 2024. In 2006 this was just 24.7%.145 More than a third of UK residents now hold a higher level qualification,146 and 60% of 25-34 year-olds, compared to the OECD average of 47%.147
In theory the UK population is more educated than ever before. But the financial returns on higher education have been falling.148 The average graduate now earns only 1.6 times the national living wage, down from 2.5 times more in 2001.149 The real returns to higher education once loans and opportunity cost have been taken into account can even be negative.150 For those born between 1993 and 1997 student loan repayments have cut a fifth off the average net graduate premium.151
And there is evidence that the UK overproduces graduates – one in three were found to be over-educated for their current role in 2019.152 Even among those who graduated 20 years ago, when far fewer attended university and the graduate premium was 10% higher,153 about one in five would have been better off financially had they not gone to university.154 17 year-olds, who are legal minors, are both allowed and encouraged to take on tens of thousands in debt without proper information about likely return. More than a third of students will not repay their loans in full.155

Too many graduates are taking low value-added courses, with many degree types yielding median earnings after five years below the equivalent apprentice salary. Creative arts and design in particular is an example of over-production relative to economic return.
Meanwhile, a graduate earning £50,000 per year with three children under 18 and a student loan to repay can face a marginal rate of tax of 80%,157 given the high income child benefit charge (HICBC).158 Not only are financial returns to degrees in return; the cost of loan servicing is combining with the tax structure to create profound disincentives to work and to earn more.
Despite this graduate over-production, the UK still has a skills shortage, with 62% of organisations reporting difficulties finding workers with the right skills.159 The UK has little skills planning, with training entirely supply-driven rather than demand-driven.
Britain has particular shortages in science, engineering, mathematics and technology (STEM). Nearly half of UK STEM employers say they need to look abroad to find the right skills for their business,160 and the STEM skills gap has been projected to cost the UK economy £120 billion by 2030.161
Meanwhile, the number of apprenticeships available has been in steep decline, falling by a third between 2016 and 2023.162 The Apprenticeship Levy was designed to increase the supply of apprenticeships by creating a financial incentive for businesses to offer them, but has not yielded the desired results, while remaining largely unpopular with businesses.163
The introduction of T-levels in 2020, a vocational alternative to A-levels, was intended to create stronger alternatives to a traditional academic route. However, uptake has not been strong and there have been calls for reform.164

Source: Department for Education165
The UK higher education system is in need of major reform. The UK has some of the world’s most outstanding universities, but also much weaker ones, and not all students receive a good or fair return on their investment. Meanwhile, it is far from clear that the sector is producing the technical and economically valuable skills the economy requires.
A much more economically-driven approach, focused on building valuable skills and more localised planning between education providers and businesses is required, along the lines of Germany’s dual education system.166
Britain’s problem is not a lack of potential. It is home to some of the world’s greatest innovation, and innovation is what drives growth. But major surgery will be needed to re-engineer its economy into one that is higher-investment, higher-wage, higher-growth and more productive.
Crucially, faster growth and greater fairness are not in tension – they can only be achieved together. Without opportunity for younger people to acquire assets, talent will leave and incentives will be killed off. Likewise Britain’s high-spending, high-borrowing state will never be reduced if regional performance beyond the South East is not achieved. Above all, capturing more value in global supply chains would go hand in hand with greater economic security, as Britain’s degree of dependence on hostile powers like China will be reduced.
The web of restrictions, taxes and regulations that hold back market led growth must be unpicked. But at the same time a strategic state is needed to rebalance Britain’s trading relationship with the world, incentivise high-value industries to invest here and reduce Britain’s reliance on the kindness of strangers. Above all, a higher growth economy will require political boldness and radical change.
These challenges are profound and frequently intersect – the problems must be faced simultaneously. But it is not acceptable for Britain to go into decline. Onward’s Rebuilding our Economy programme will seek to tackle the ten themes of this launch paper in the coming months and years, proposing major changes to UK public policy and the solutions Britain’s economy needs.
The UK has been stuck for nearly two decades. But a turnaround is possible – it will be down to Britain’s leaders and policymakers to make the choice for a different and better future.
If you value the work we do support us through a donation. Your contribution will help fund cutting edge research to make the country a better place.